Per-tenant AI token usage and cost
Every Gemini call now writes one row into our own database: how many tokens it used, which model answered, and which API key paid for it. Three pages read those rows and show tokens plus an estimated dollar cost, per tenant, per feature and per model.
Built on branch feat/tenant-ai-token-usage. Nothing is committed yet. There is no Jira ticket and no PR.
Not on beta. Not in production.
The screenshots come from a local stack running this branch. The usage rows are seeded demo data, so the numbers are invented. The screens themselves are real.
What it does
- Saves one row per AI call with input, output, thinking and cached token counts.
- Marks each row with the key that paid for it: the platform key, or the tenant's own key.
- Groups those rows by day, by feature, by model and by tenant.
- Works out a dollar estimate from a price table we keep in the code.
- Never blocks or breaks the AI call it is measuring.
Who sees what
| Who | Where | What they see |
|---|---|---|
| Tenant admin | LMS, admin Usage page | Their own tenant. All token counts. Cost only for calls paid by their own API key. |
| Platform admin | Control plane, tenant detail, Usage tab | One tenant. All token counts and the full cost, split into platform key and tenant key. |
| Platform admin | Control plane, AI usage page | Every tenant together. Totals, cost split, and tables by tenant, by feature and by model. |
Walkthrough
Captured at 1440 pixels wide with the app sidebar open, against a local build of this branch. Today in the demo data is 20 September 2026.
1. LMS, tenant admin, current month
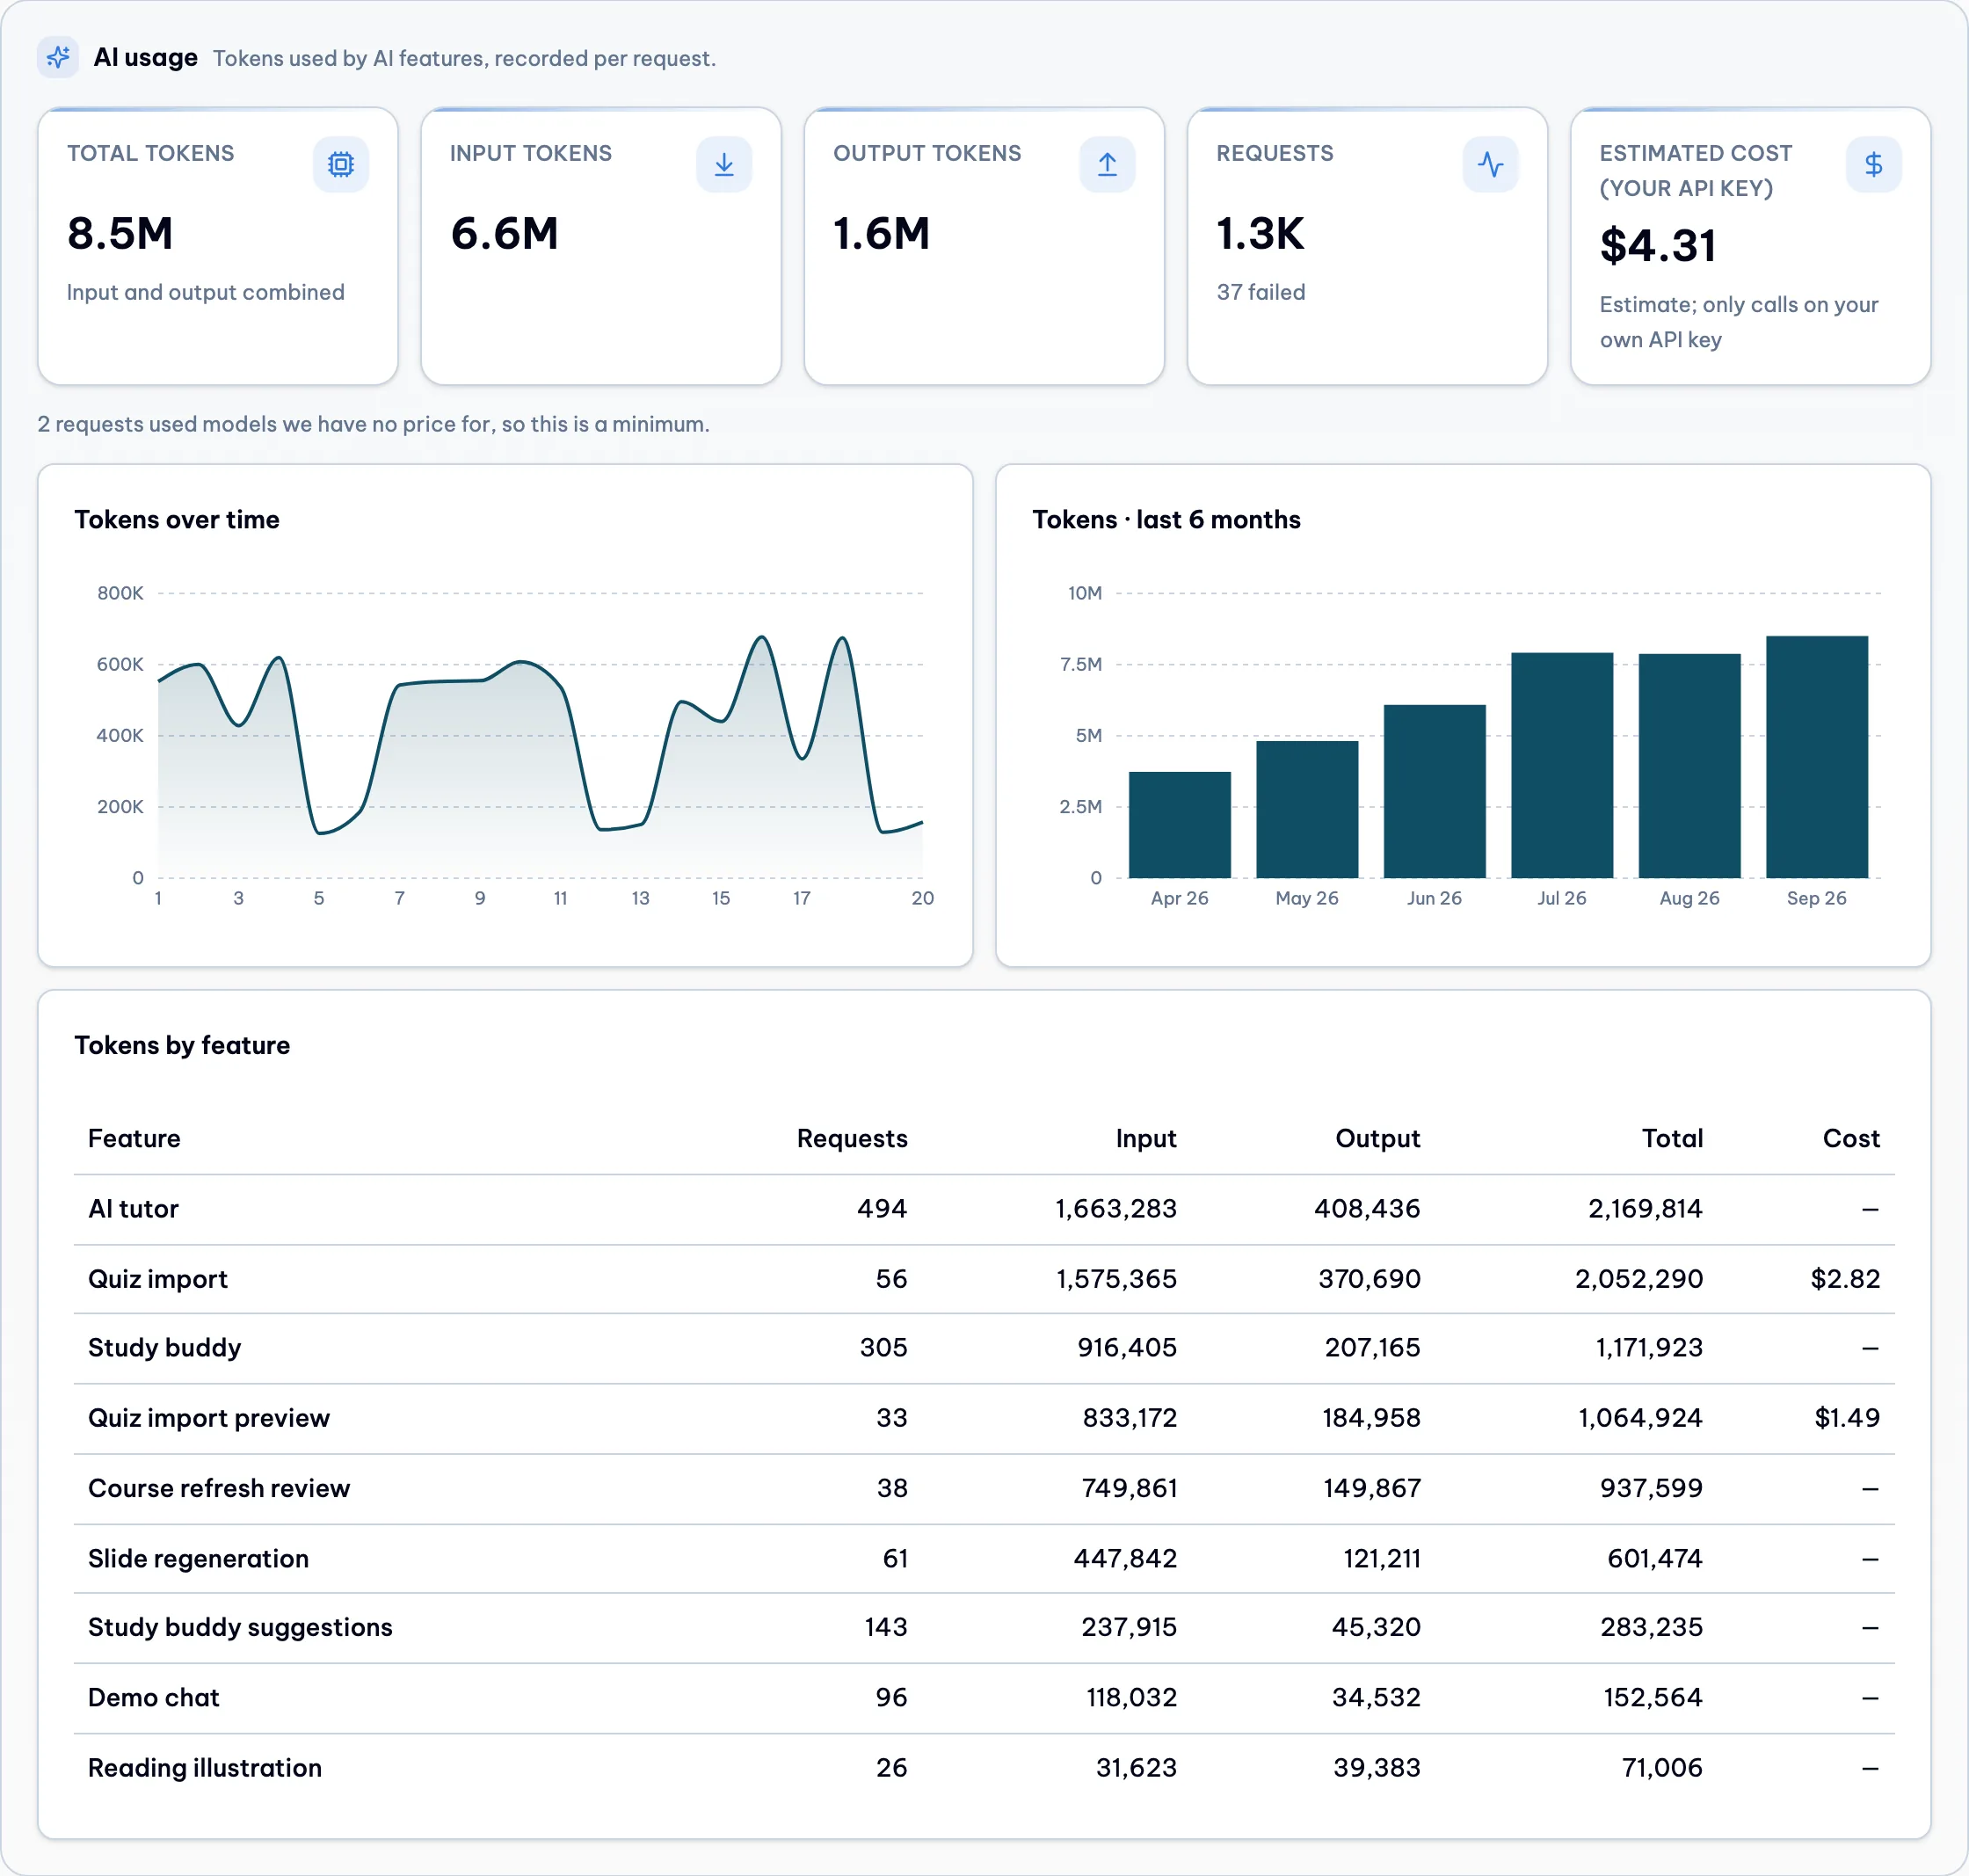
This is the new block at the bottom of the admin Usage page. Five tiles, then the daily line next to the last six months, then the feature table across the full width. The cost tile says $4.31 because a tenant admin only sees the cost of calls paid by their own key.
2. LMS, previous month
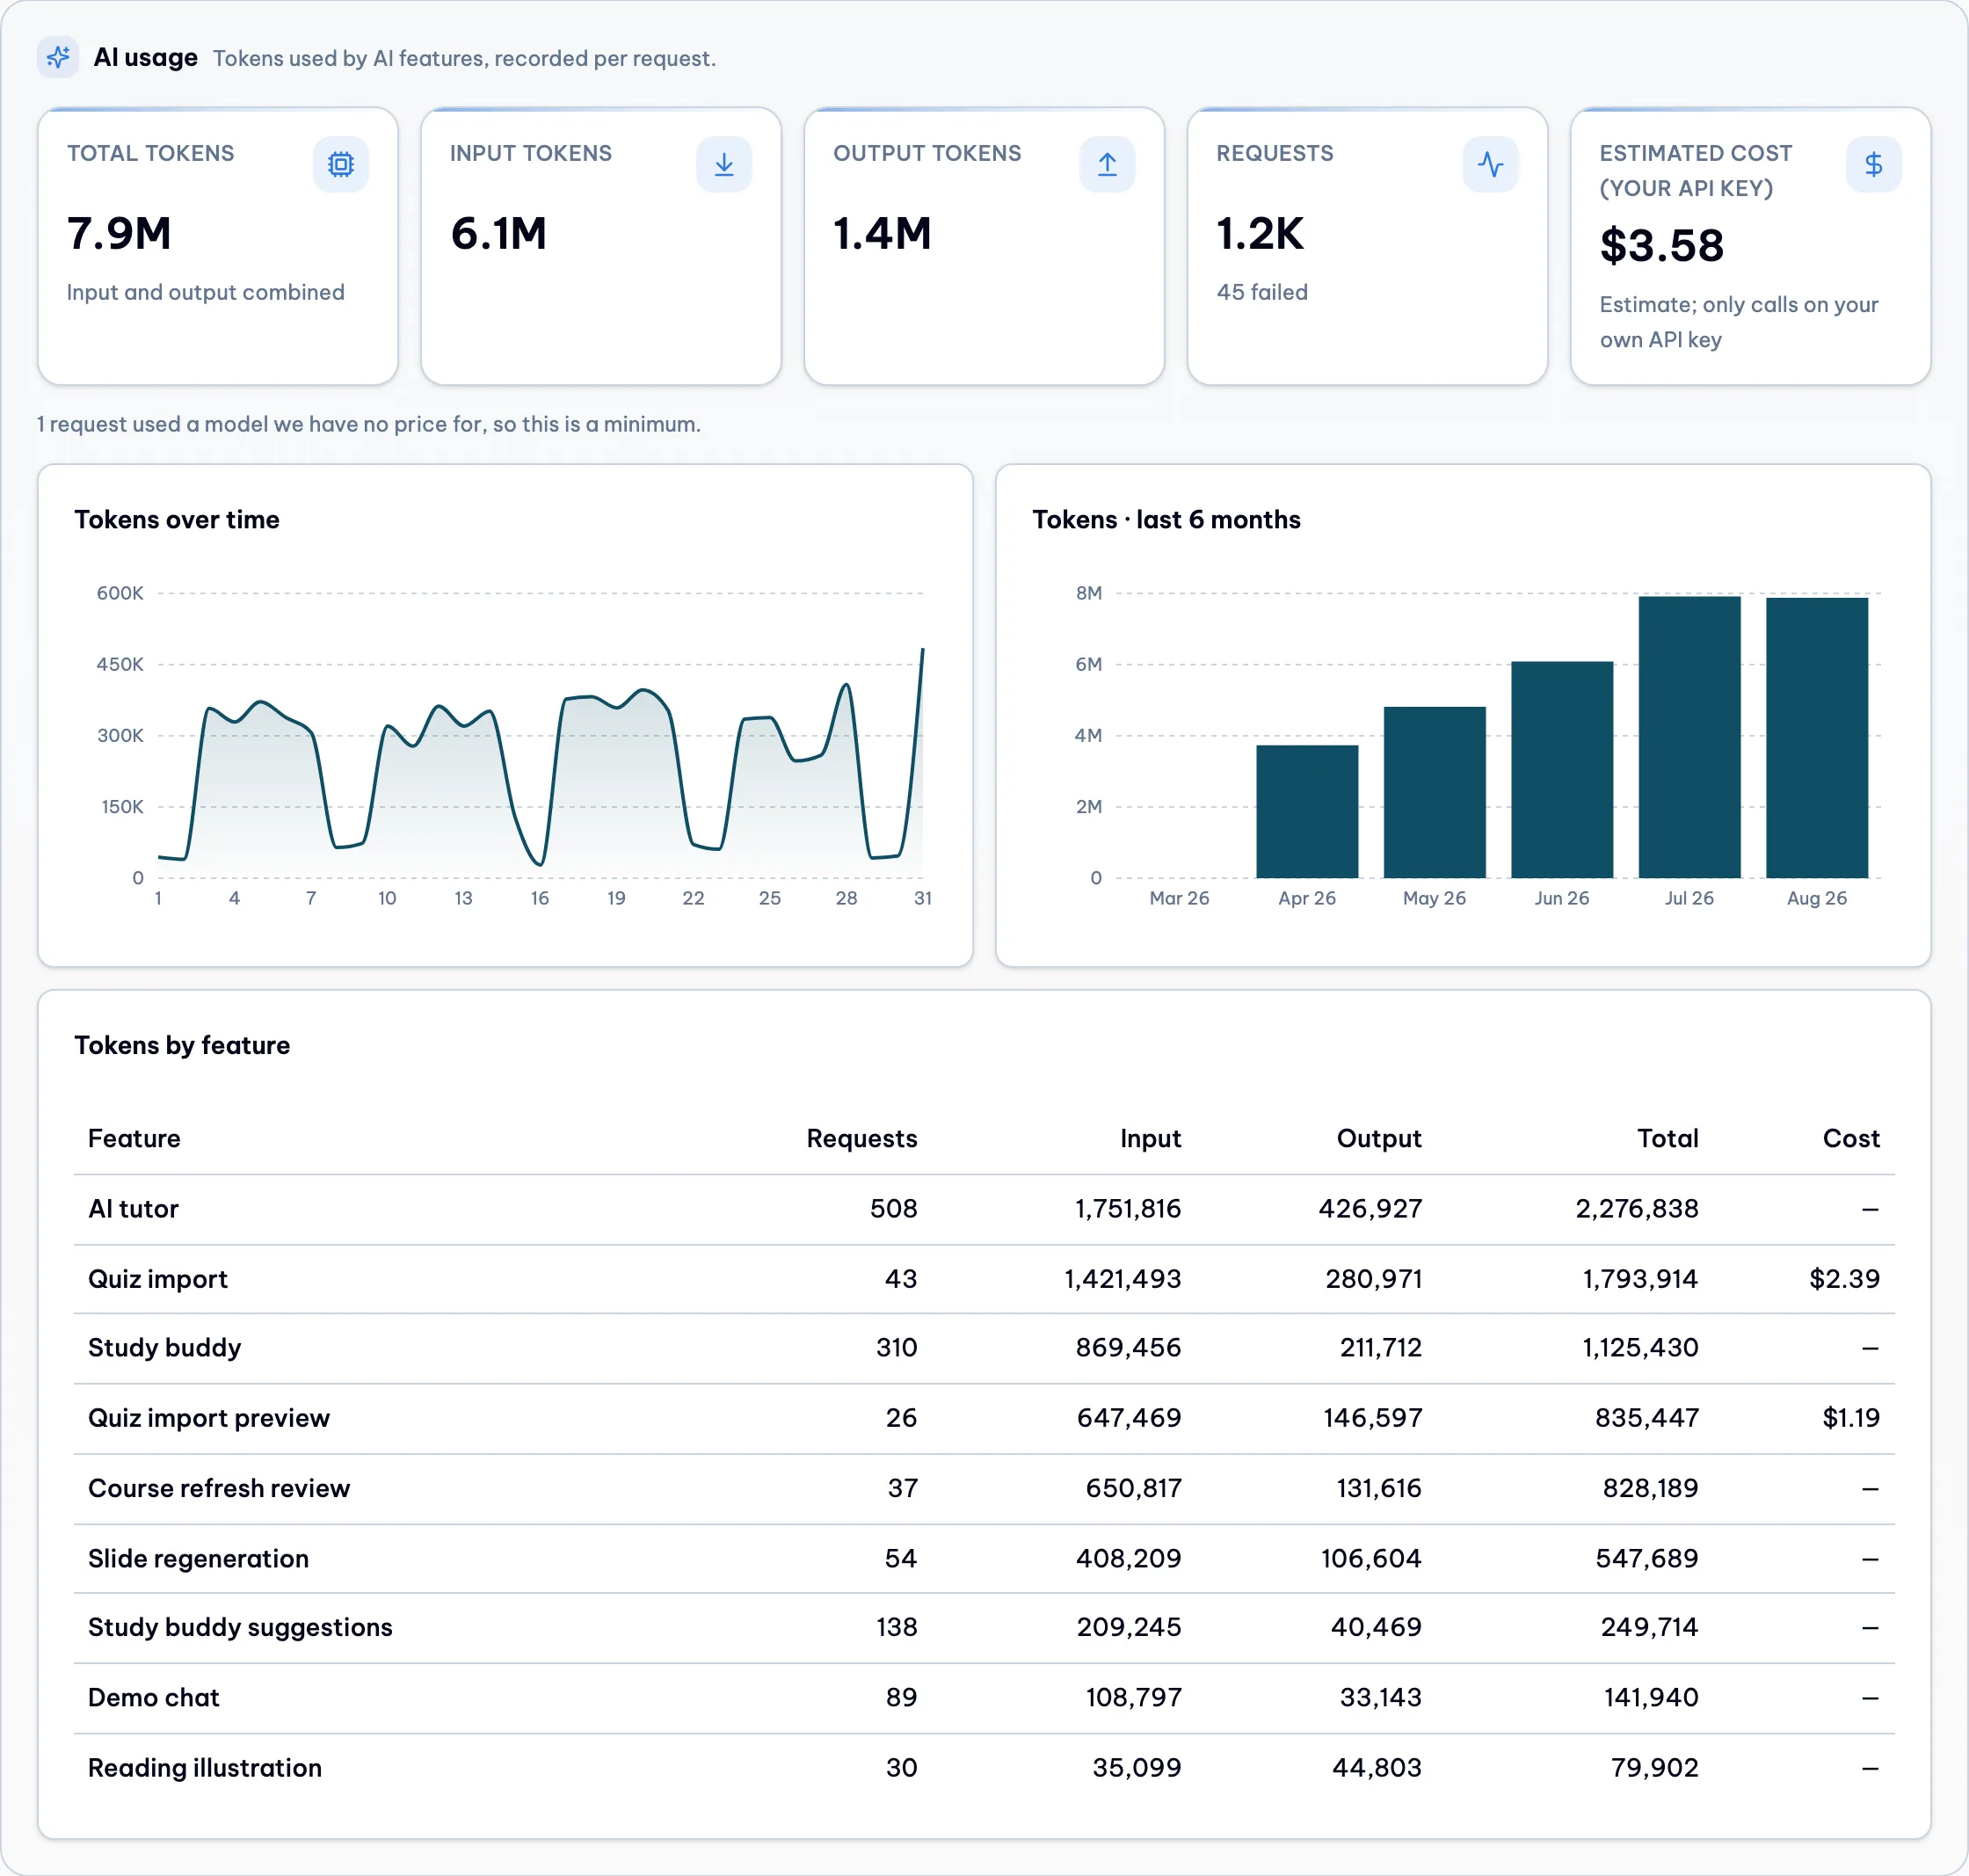
The month arrows in the page header move the whole page, including this block. Here it is August: 31 days on the daily chart, and the six month bars end at August.
3. LMS in Vietnamese
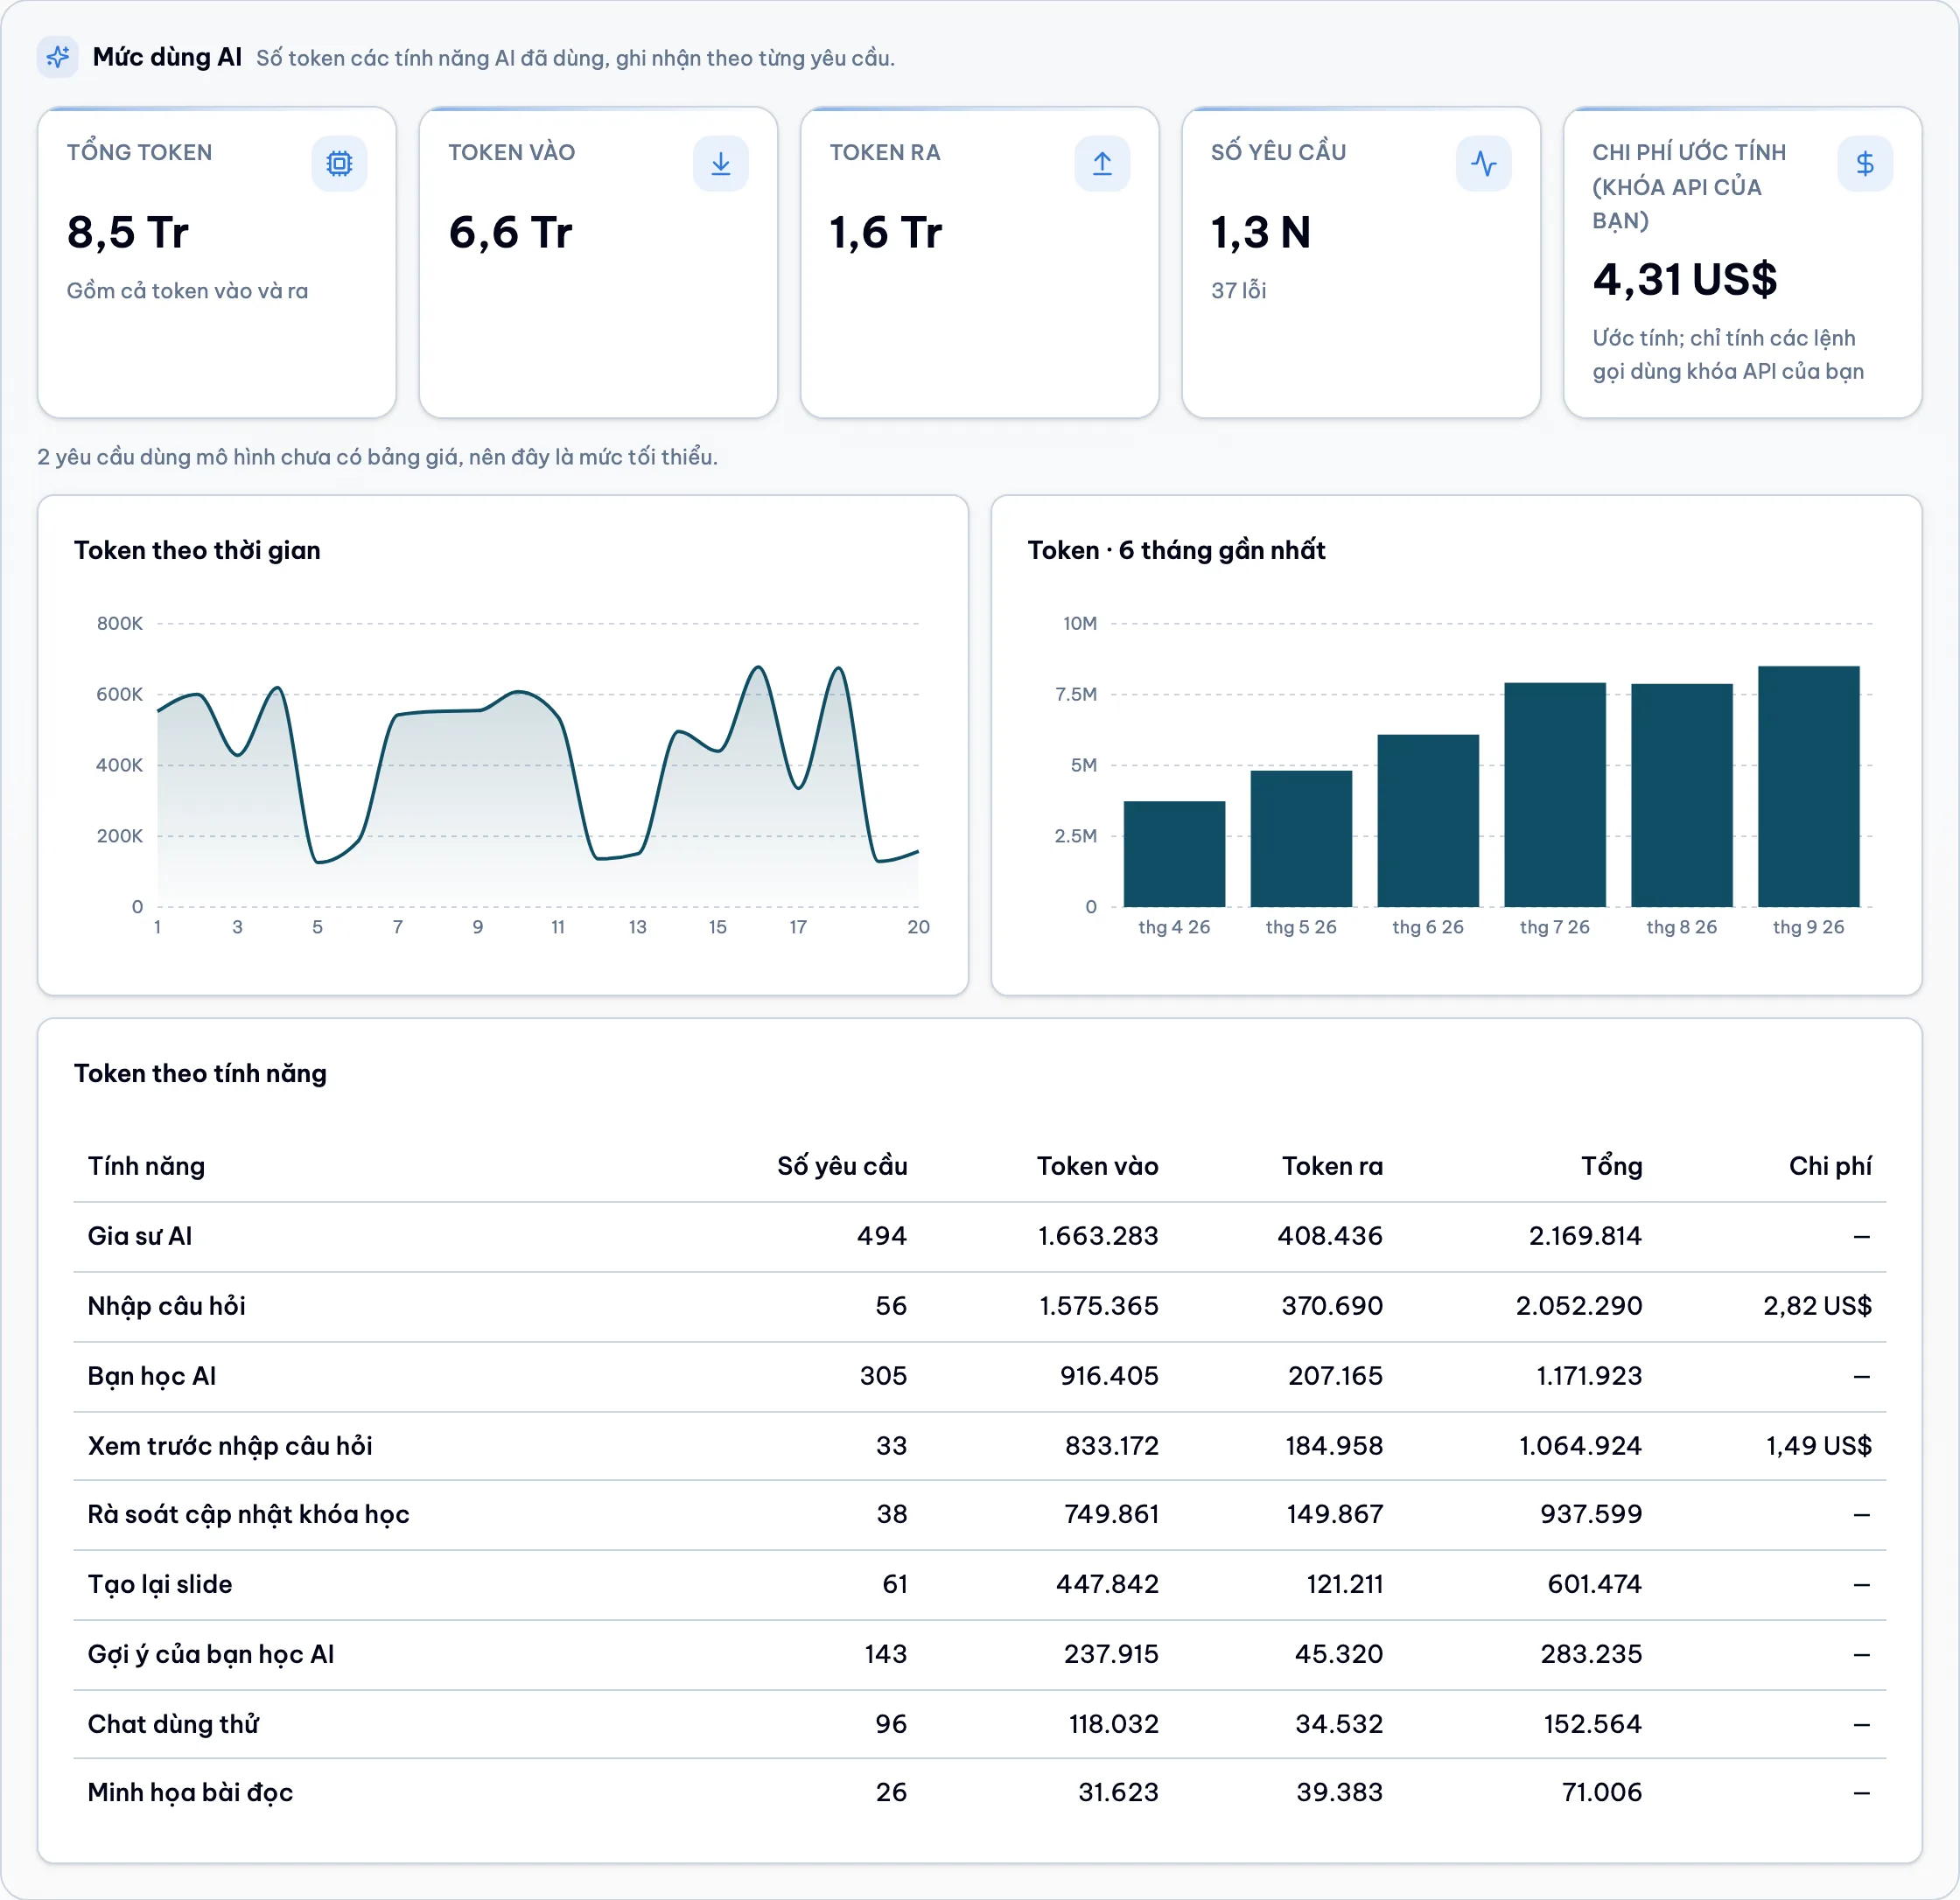
All labels, feature names and number formats follow the language. Tokens become "8,5 Tr", the cost becomes "4,31 US$".
4. Control plane, one tenant
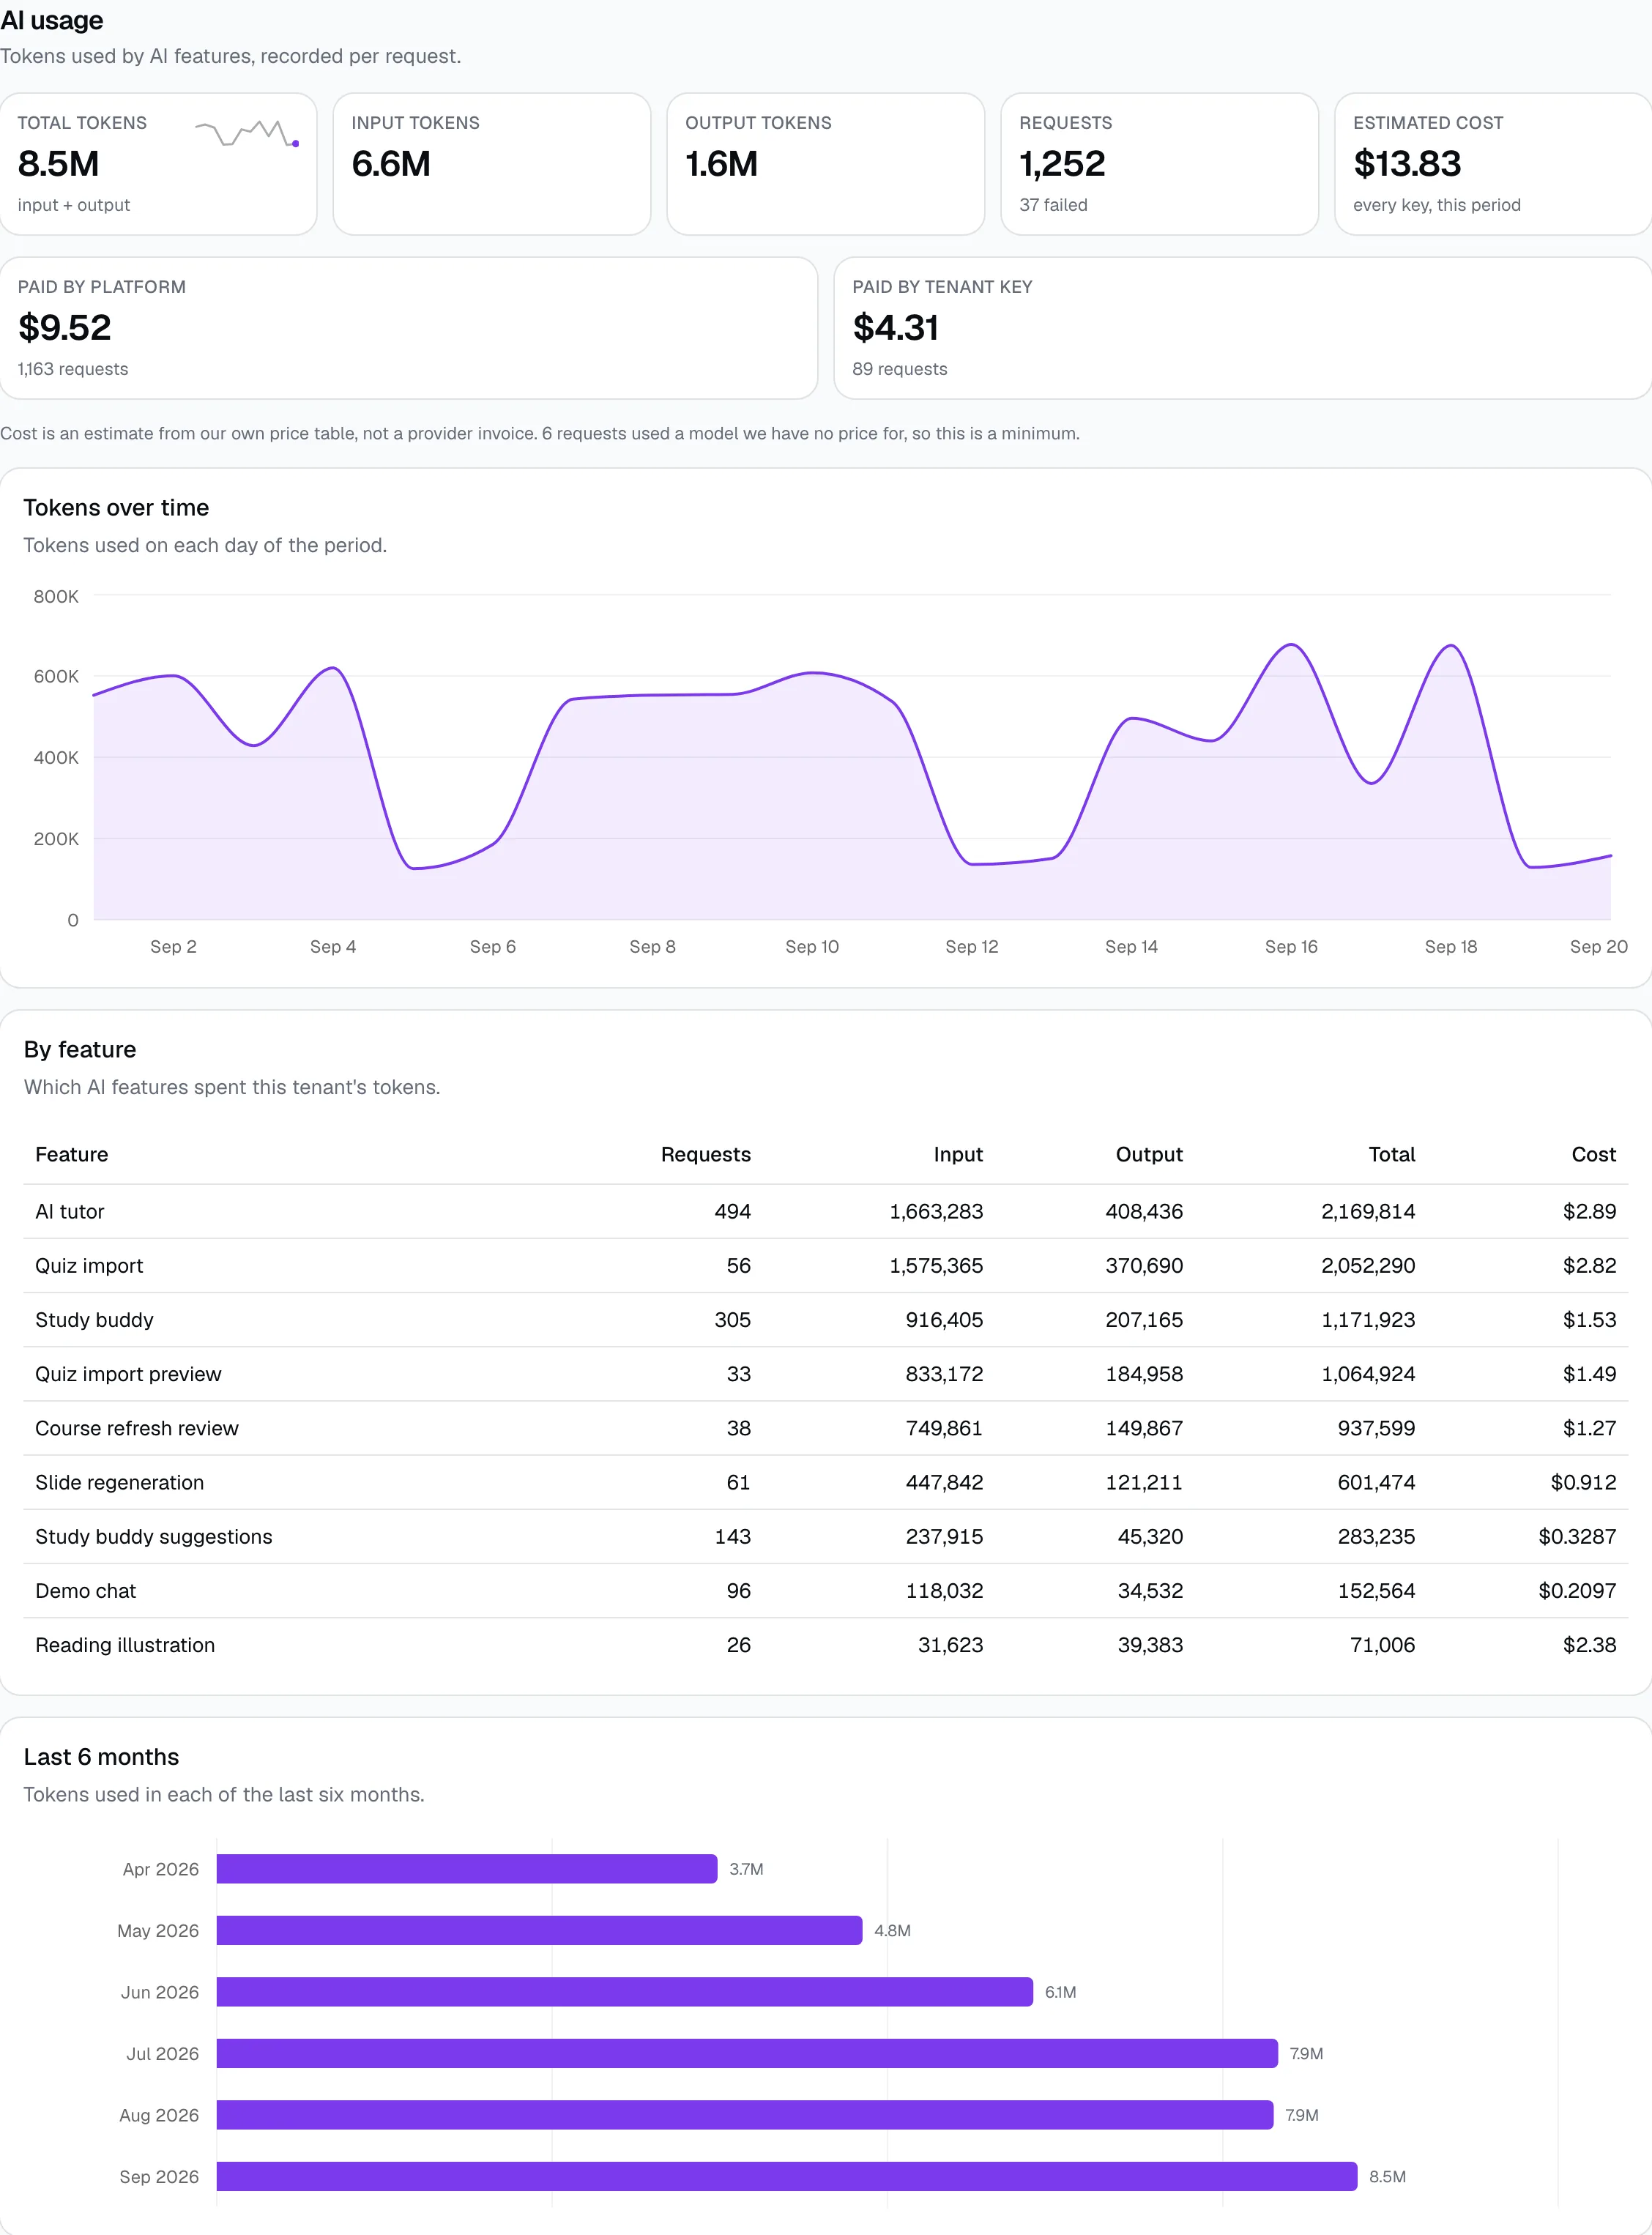
Same tenant, same month, seen by a platform admin. The full cost is $13.83. Under the main tiles, two tiles split it: $9.52 paid by the platform key and $4.31 paid by the tenant key. That $4.31 is the number the tenant admin sees in screenshot 1.
5. Control plane, every tenant
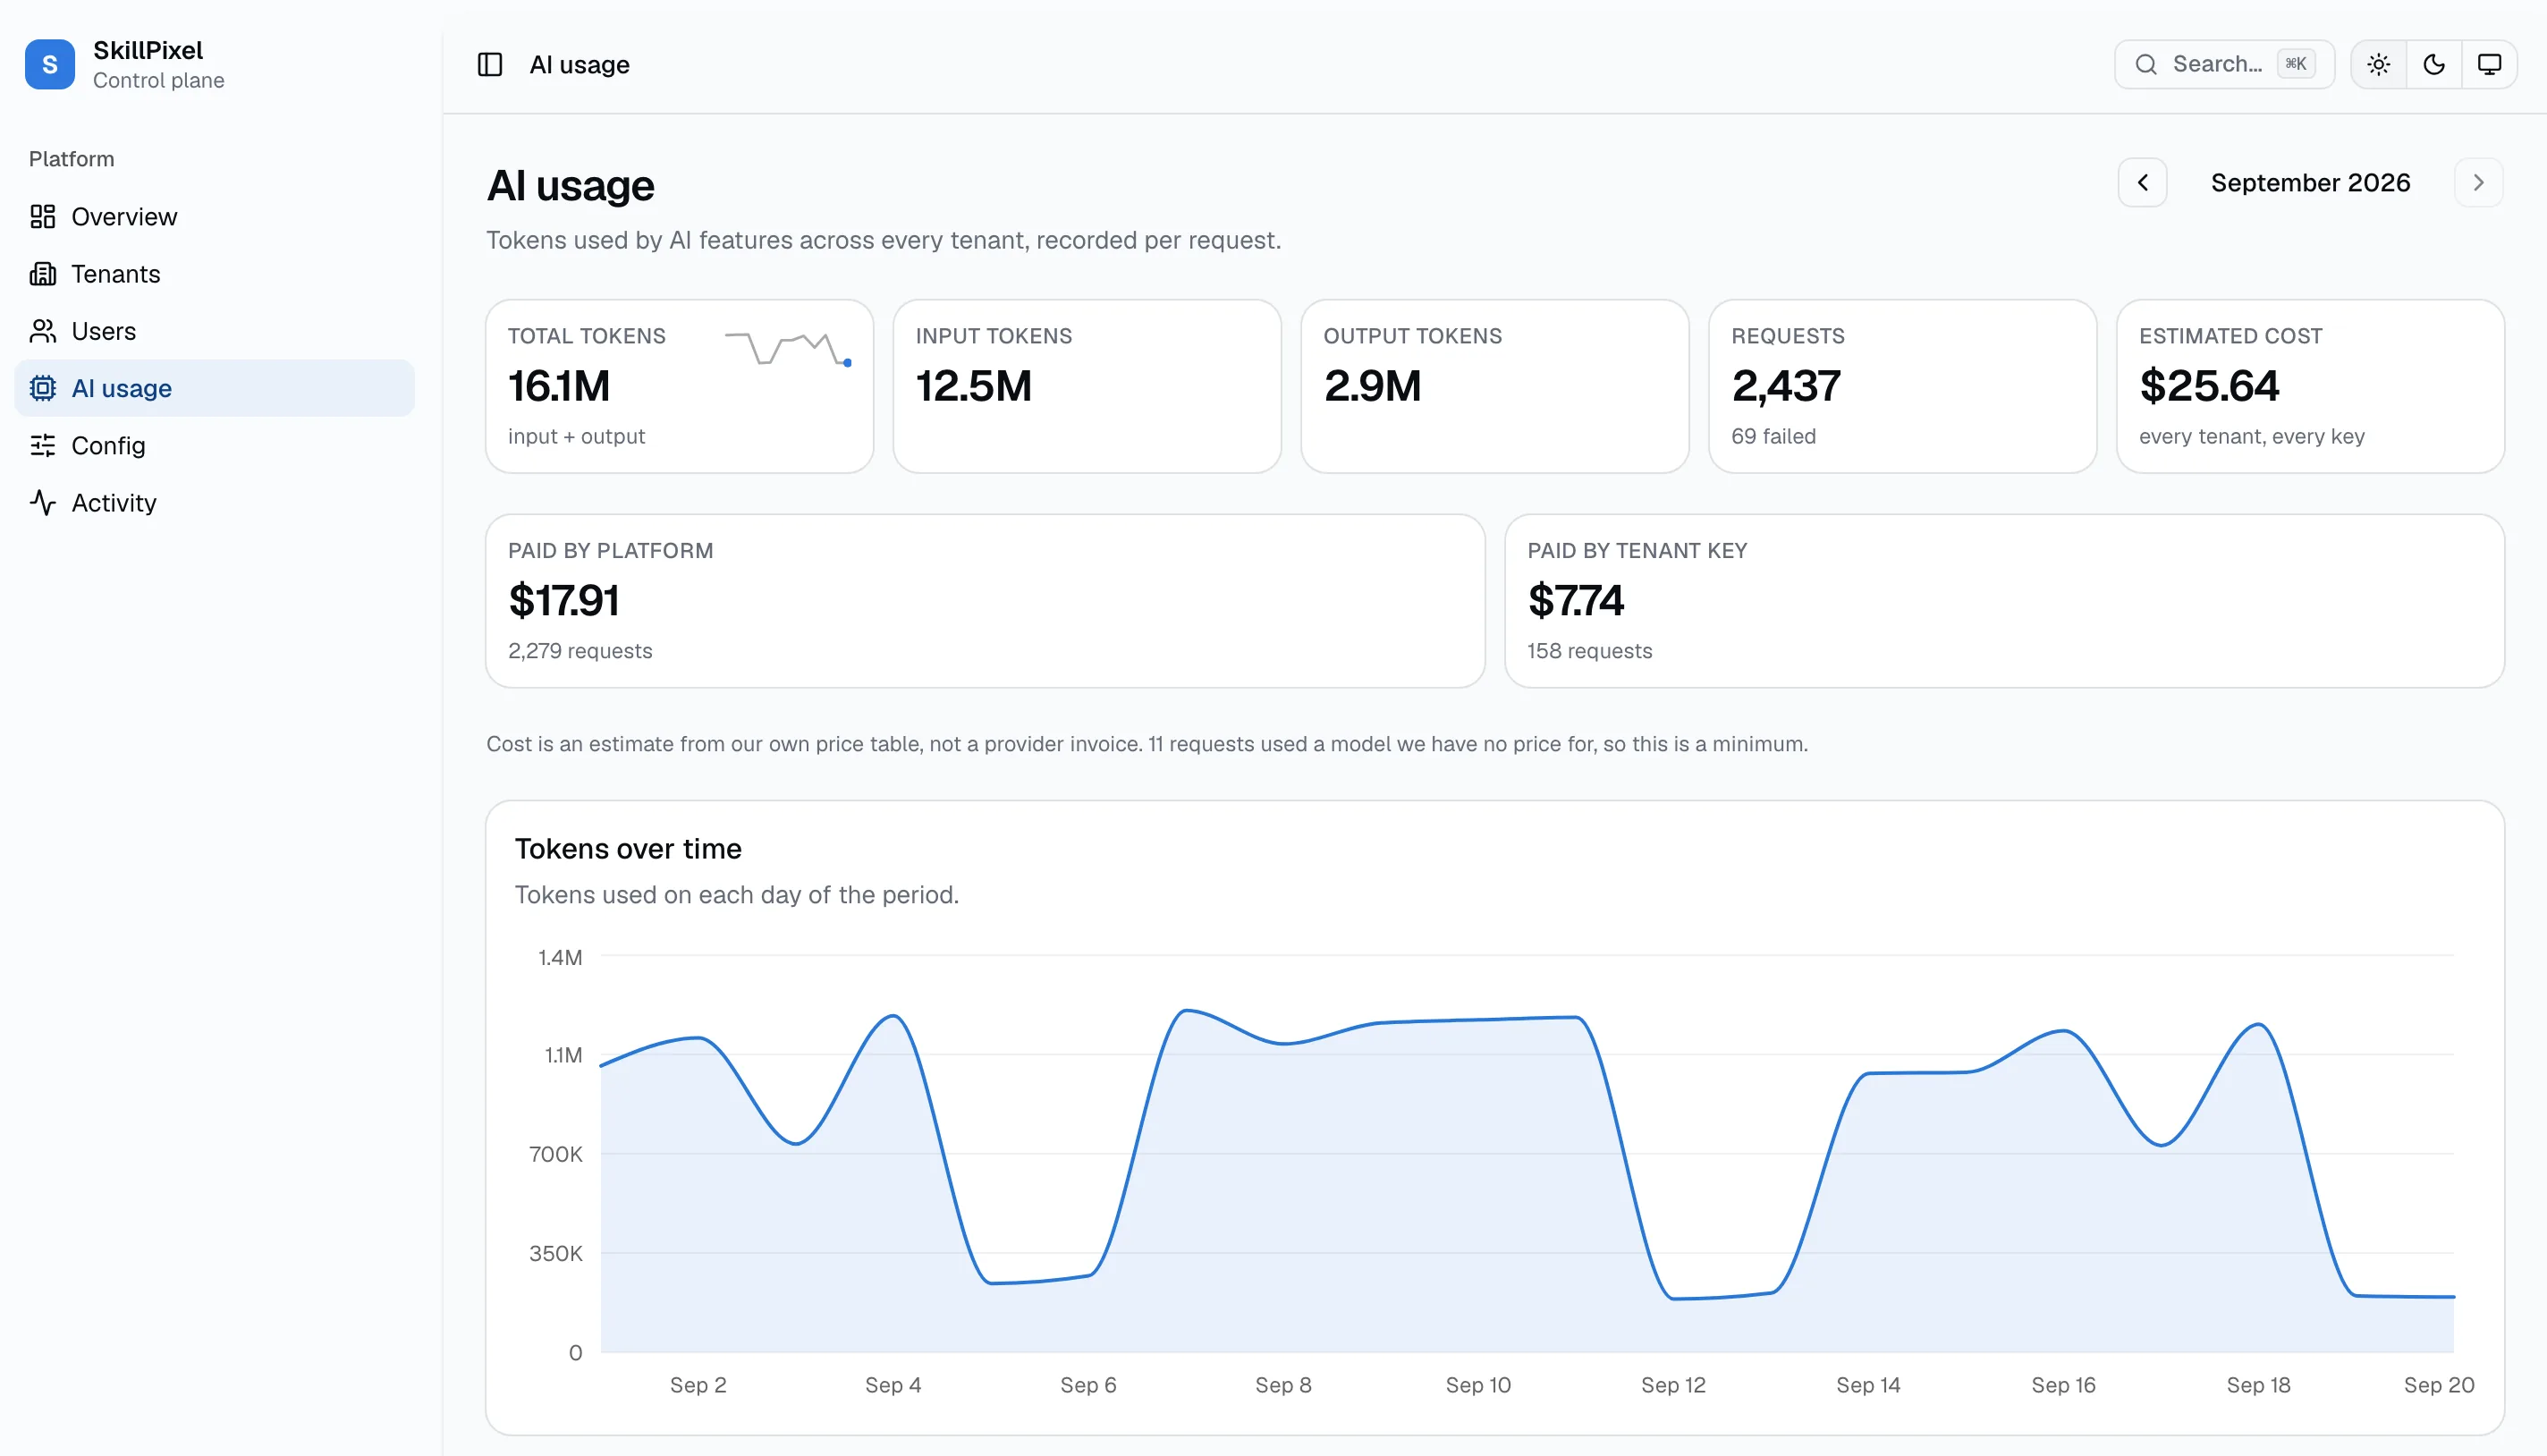
A new AI usage entry in the left nav opens the platform-wide page. Same shape as the tenant block, but the numbers cover all tenants: 16.1M tokens and $25.64 for September.
6. The three tables
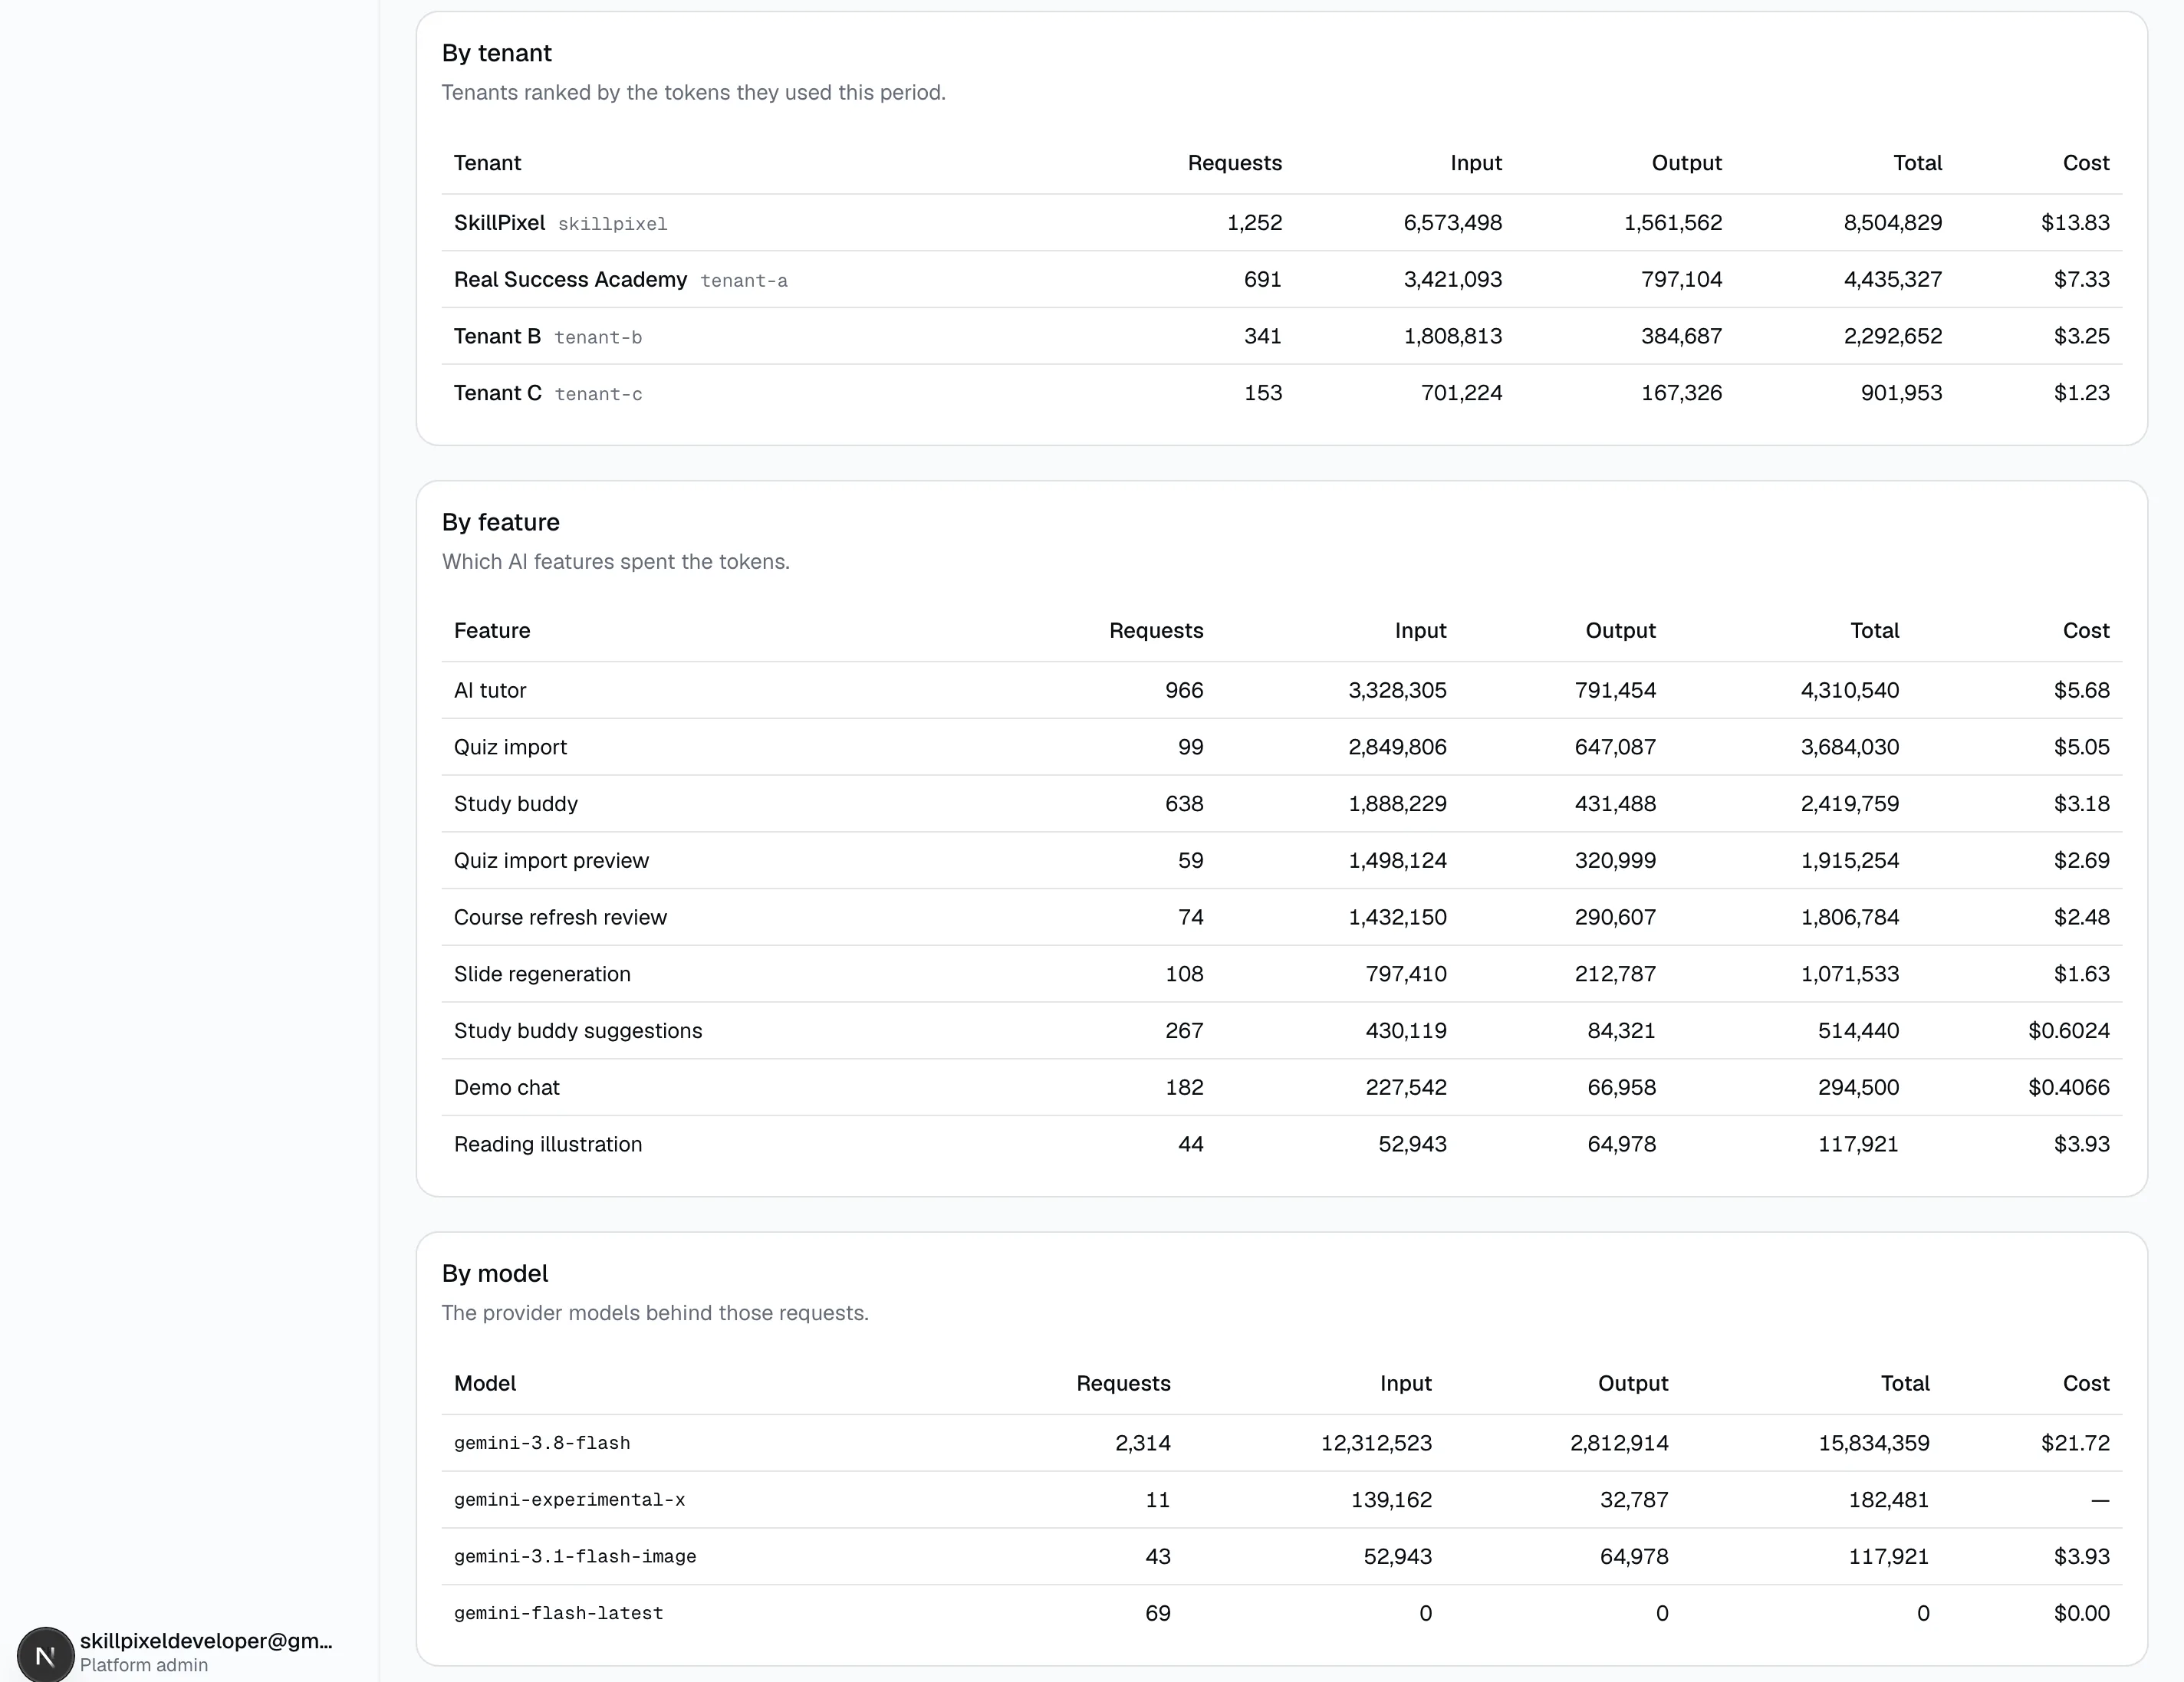
By tenant is sorted by tokens, and each row links to that tenant. By feature and by model sit below it, each across the full width.
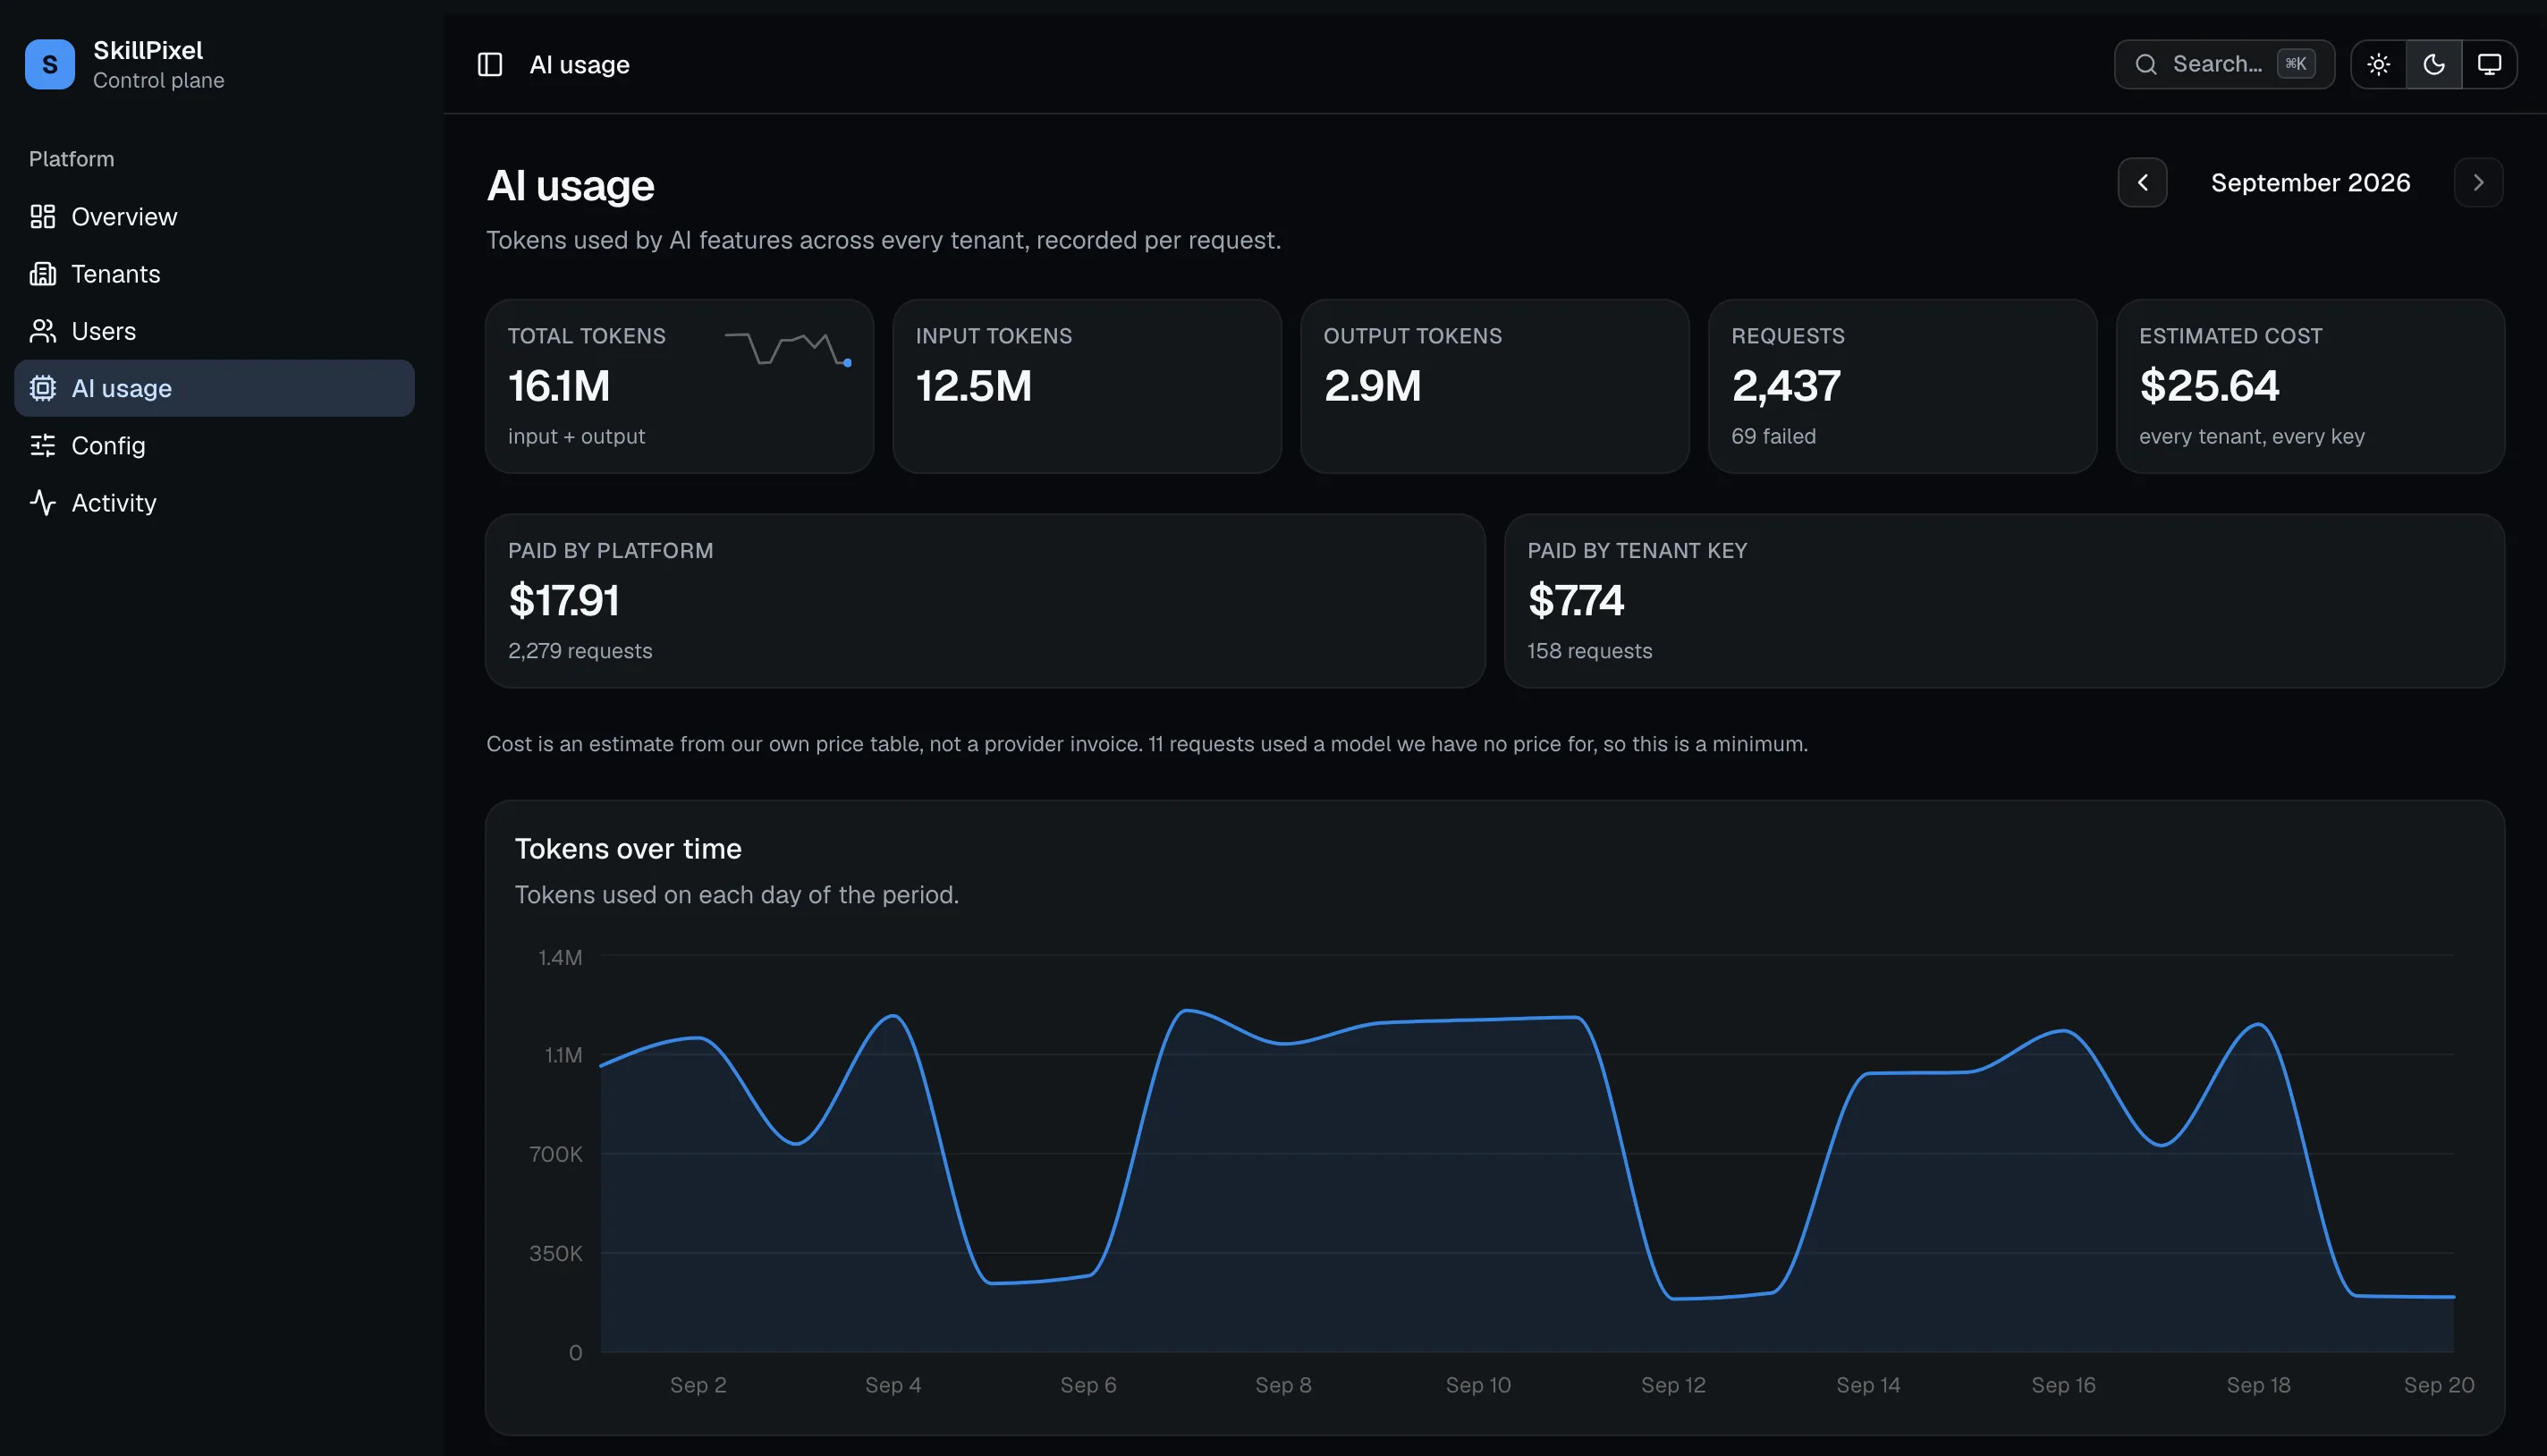
7. Dark mode
How usage is recorded
- One row per AI call, written right after the model answers.
- The row is saved even when PostHog tracking is switched off. The two are separate paths.
- If saving the row fails, the failure is logged and dropped. The AI answer and any real error reach the user unchanged. The call is never repeated.
- Failed calls are recorded too, with zero tokens, so the failure count is visible next to the request count.
- It covers every Gemini feature we have today: AI tutor, study buddy, demo chat, quiz import from documents, and the course refresh jobs.
- Only future usage. The table starts empty, so months before this ships will be empty.
How cost is calculated
We keep our own price table in the code. Each entry names a model and a start date, so a past month keeps the price that applied back then.
Here is the sum in words. Fresh input tokens are charged at the input rate. Tokens that came from cache are charged at the cheaper cache read rate, and they are subtracted from the input count so nothing is billed twice. Output tokens are charged at the output rate, and thinking tokens go in with them because Google bills thinking as output.
Nothing is stored. The cost is worked out when someone opens the page. If we find a wrong price and fix the table, old months repair themselves on the next page load.
Gemini 3.8 Flash, USD per 1 million tokens
| Period | Input | Cached input | Output, thinking included |
|---|---|---|---|
| Until 31 Dec 2026 | $0.75 | $0.075 | $3.75 |
| From 1 Jan 2027 | $1.50 | $0.15 | $7.50 |
The 2027 prices are already entered. January will price itself correctly with no code change, and December stays on the old price.
gemini-3.1-flash-image. Its output is image tokens, priced at $60 per 1 million. In the demo month that is 44 requests, 118 thousand tokens, and $3.93. The study buddy made 267 requests for $0.60.
A model with no entry in the table shows "Unknown" or a dash, never $0.00. The page also counts how many requests had no price, so a number you see is a floor, not a guess.
Who pays
Quiz import from documents runs on the tenant's own Gemini key. Everything else runs on our platform key. The tenant admin page prices only the tenant's own key, which is why the same tenant reads $4.31 in the LMS and $13.83 in the control plane. Both numbers are right, they answer different questions.
PostHog also estimates a cost for these calls. We treat it as a cross-check on our own table, not as the source.
Limits
This is an estimate, not an invoice. Compare it with the provider bill before you bill anyone.
Four things are outside the table, so wherever they apply the real bill is higher:
- Google Search and Maps grounding, which is billed per request, not per token.
- Explicit cache storage, which is billed per hour.
- The free tier, which costs nothing but still produces rows.
- The batch and priority service tiers, which are cheaper and more expensive than standard. This backend does not use them.
Checks run
What I did not check
- The 360 pixel mobile view. Everything here was looked at on a desktop screen only.
- The control plane has no test runner, so the new page and its two API routes have no tests at all.
- The Vietnamese strings are my translation. A native speaker should read them, especially the feature names.
Layout fixes after the first pass
The first screenshots showed the Cost column pushed out of its card. Every table that carries a cost now gets a full-width row, in the LMS and in the control plane, so the column reads at 1440 pixels in English and in Vietnamese with the sidebar open. The chart axis labels and the "Total tokens" hint were also being clipped, and both are fixed. Every screenshot here was retaken after those changes, with the sidebar open.
Open items
- There is no cleanup job. One row per AI call, kept forever. A retention window or a monthly rollup is a separate decision, but it should be made before this runs for a year.
- Nothing warns when the price table goes stale. Somebody has to watch Google's pricing page.
- The cache write column is always zero. Gemini does not report cache writes. It only starts to matter when a provider that does report them is wired in.
- The branch that adds OpenAI and Anthropic to document import needs the same recording hook. Without it, those calls produce no rows and no cost.
- Still to do: a Jira ticket, a commit, and a PR.